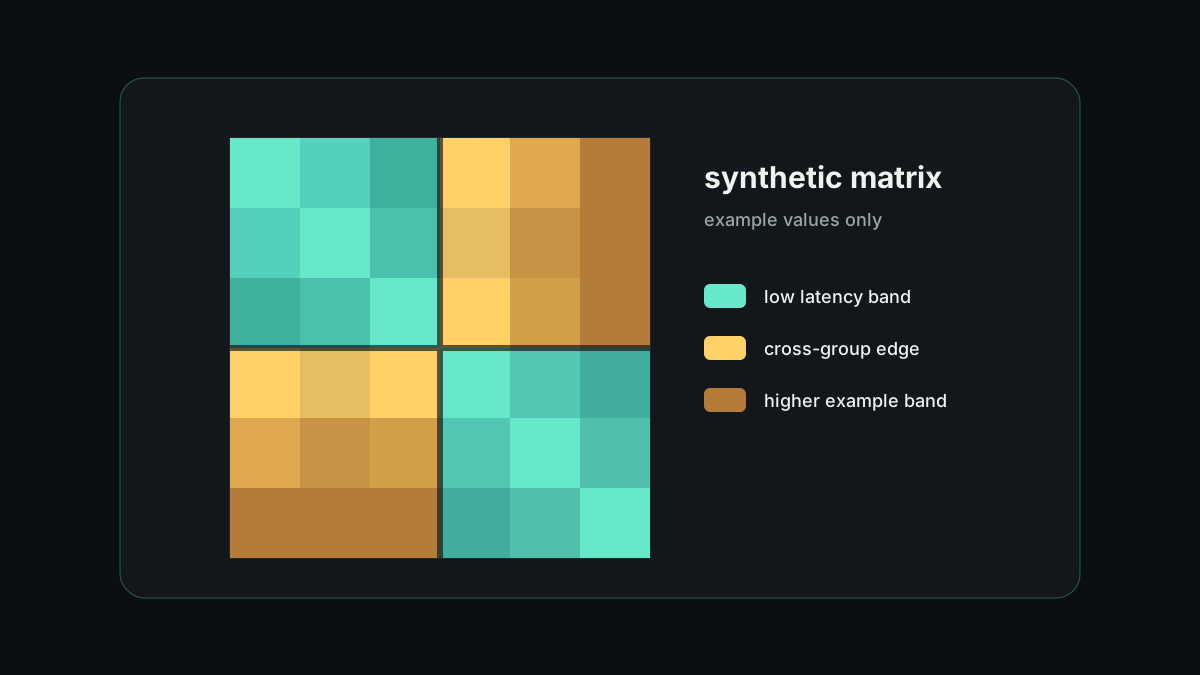
This project started from a core-to-core latency measurement. The raw table was useful for offline analysis, but it hid the structural shape of the machine: nearby cores, cross-group jumps, and outlier pairs are much easier to inspect as a matrix.
Project Overview
The React entry reads c2c.csv, a matrix component fills missing cells and manages interaction state, and the SVG layer draws the heatmap grid, axes, legend, and hover details.
The tool is useful for observing topology from latency data. It fits NUMA or CCD grouping checks, outlier investigation, and comparisons across system settings.
Data Model
The input is reduced to source core, target core, and latency. The loader builds a complete matrix, keeps missing cells explicit, and maps latency to color. A logarithmic scale prevents a few extreme values from hiding the normal range.
Hover state and selected cores only affect highlighting; the parsed matrix is kept stable. That makes the interaction simple and cheap even when the grid grows.